|
Current Economic Statistics and Review For the
Week | ||||||||||||||||||||||||||||||||||||||||||||||||||||||||||||||||||||||||||||||||||||||||||||||||||||||||||||||||||||||||||||||
|
Service Sector Contribution to India’s GDP Growth * 1. Introduction The growth of India’s GDP, especially after the 1990s, was greatly influenced by the opening-up of the economy. This paradigm shift in Indian economy occurred in the wake of balance-of-payments crisis of the 1991. The Government of India opened up Indian markets to facilitate entry of private foreign investments into the Indian markets. This change in Indian economic policy, from a highly insulated market to an open market facilitated inflow of foreign direct investment (FDI) and portfolio investments by foreign institutional investors (FIIs). While the growth rate picked up from early 1980’s onwards, in the recent past, i.e., from the financial year 2003-04 onwards the growth of GDP at factor cost reflected a level jump from about 6.5% to 8.5 to 9%. This significant rise was mainly due to rise in services and manufacturing activities. After posting a higher growth for five years, GDP growth rate for the fiscal year 2008-09 witnessed a lower growth of 6.7%, on the backdrop of global crisis. The growth rate is expected to remain at the same level in 2009-10, but is predicted to regain after 2010-11. This note attempts to trace the pattern of sectoral growth and the increasing share of services sector since the reform period. 2. Gross Domestic Product – Sectoral Growth Pattern
The decadal growth pattern across sectors is reflected in the changing share of different sectors in national GDP. From a peak of 53.3% in 1950-51 to 60-61 the share of agricultural sector came down to 20.5% for the period 2001-02 to 2007-08. Slow down in its share started reflecting during the period 1981-82 to 90-91 when industries and services sectors gained speed. Thereafter, while the manufacturing sector has been posting a higher growth, the share of services sector started rising tremendously and contributed the most to GDP growth rate (Chart B).
3. Causes for lower Contribution from Agricultural Sector Some of the major factors contributing to low growth and contribution to GDP by the agriculture sectors are:
4. Industrial Sector The industrial sector is made up of manufacturing, mining and quarrying, and electricity, water supply and gas sectors. The various sectors in Indian industry are gaining more and more importance. Within the industrial sector, the major contribution is derived from the manufacturing sector. The manufacturing sector played a significant role in achieving the higher economic growth rate. Besides being a significant contributor to the GDP growth, it is the second largest employment provider to the country’s skilled as well as unskilled labour force and a major contributor to export.
There has been moderation in growth rate of industrial sector for the year 2007-08. The performance of the manufacturing sector increased steadily from a negative growth of 2.4% in 1991-92 to 11.8% in 2006-07. Mining and quarrying has registered a higher growth of 8.8% in 2006-07 as against 3.4% in 1991-92. The growth in electricity, gas and water supply has witnessed a lower growth in 5.3% in 2006-07 as against a higher growth of 9.7% in 1991-92. Whereas, for the year 2008-09, industrial sector saw its major slow down as this sector was badly affected by global crisis. The rebound in the industrial sector in conjunction with the services sector has powered India’s GDP growth since 2003-04 and has led to build up of optimism of targeting still higher growth for the economy. The resilience shown by the industrial sector against the hardening of global oil prices is reflective of inherent strengths and capabilities that the industrial sector has built up over the years since the initiation of economic reforms in the country. Improvements in infrastructure facilities will be critical to sustain and accelerate the current industrial growth. A substantial manufacturing base is essential to absorb the workforce and ensure sustainable growth of the economy. Apart from improvements in physical and social infrastructure, this would, inter alia, require imparting requisite skills to the labour. Furthermore, the Indian industry needs to step up research and development expenditure to improve its competitiveness in the global economy to move up the value chain and to strengthen its position in skill intensive industries.
5. Services Sector The main thrust in recent years to GDP growth has come from the services sector. Services contribute currently to about 56.0% of the GDP. Rapidly, the quality and complexity of the type of services being marketed is on the rise to match worldwide standards. Whether it is financial services, software services or accounting services, this sector is highly professional and provides a major impetus to the economy.
IMF Working Paper, “Understanding India’s Services Revolution” prepared by James Gordon and Poonam Gupta in September 2004 had explored the factors behind the dynamism of the services sector in India. One explanation suggested that income elasticity of demand for services is greater than one. Hence, the final demand for services grows faster than the demand for goods and commodities as income rises, which results in fast growth of services. Another explanation is that technical and structural changes in an economy make it more efficient to contract out business operations, which are done internally by individual firms. This type of outsourcing has been called the “splintering” of industrial activity. Splintering result in an increase in net input demand for services from the industrial sector, and in turn, the services sector grows proportionately faster than other sectors. They suggested that there is considerable scope for further rapid growth in India’s service economy, as Indian services exports have strong future growth prospects, but also found that there is considerable scope for further rapid growth in other segments provided that deregulation of the services sector continues. Nevertheless, it is imperative that the industrial and agricultural sectors also grow rapidly. The relatively jobless nature of growth in India’s services sector further underscores this need.
Following the trade liberalization in 1991, the Indian economy embarked on a path of rapid growth of aggregate output. In particular, it witnessed a high growth rate of service sector output while that of industry was relatively muted. As a result, the share of services in GDP has come to resemble that of a high income country while its per capita income still remains that of a low income country.
The service sector accounts for more than half of India's GDP, this sector has gained at the expense of both the agricultural and industrial sectors through the 1990s. The rise in the service sector's share in GDP marks a structural shift in the Indian economy and takes it closer to the fundamentals of a developed economy. In the developed economies, the industrial and service sectors contribute a major share in GDP while agriculture accounts for a relatively lower share. Services sector includes trade, hotels and restaurants, transport storage and communication, financing, insurance, real estate and business services. The contribution of each sub-sector of services has been shown in (Table 2).
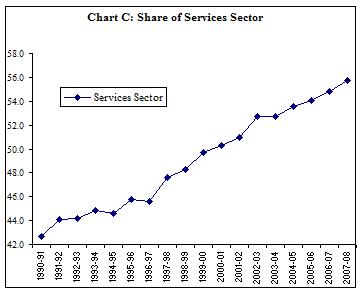
Within it, the share of transport, storage and communication as well as community services has increased over the period. The fact that the service sector accounts for more than half the GDP probably marks a structural break in the evolution of the Indian economy. (Chart C).
When one does a deep dive into the services sector one finds that 80% of employment is within construction and informal trade and the rest is divided between IT and Information Technology Enabled Service (IteS), retail, etc.
This point elucidates the breadth and impact of the services sector that through IT and ITeS has showcased India’s technology skills to the world and also highlights the employment capability within this sector. Among the people working in the services sector, 90% do not have basic elementary education and 30-40% are completely illiterate. IT and ITeS have the highest bar on quality. For instance, technical employees in the IT sector require an engineering degree whereas just one of 500 in the retail sector requires the equivalent managerial skills. The services sector is expected to contribute to over 70% of the economic growth in India over the next five years, and 60% of new jobs over the next five years is to be generated by services.
Civil Aviation in India has developed rapidly in recent years. The rapid rate of expansion has been possible due to its relatively modest starting point, however, further growth will require massive investment in infrastructure, redesigning airspace and improving the overall air traffic management system, together with changes in procedures, while maintaining strict adherence to the international standards of safety and security. The sector had been growing at an annual rate of up to 25.2%. In 2007 the Civil Aviation Sector in the country has witnessed a boom as the domestic passenger carriage, cargo movement and international air traffic had shown an exponential growth. This growth has been largely due to policy of increased liberalization both on domestic and international sectors. Domestic passenger traffic increased to 43.3 million in 2007, which was an increase of 36.7% compared to 2006. (Ministry of Civil Aviation 2007).
Within the automobile sector, automobile production trend reflects that the number of vehicles has gone up from 6.3 million in 2002-03 to 11.2 million in 2008-09. The automobile sector has been contributing its share to the shining economic performance of India in the recent years. With the growing middle class with higher per capita income, the demand for private vehicles including cars and two-wheelers has picked up. Product movements and manned services have boosted the sales of medium and sized commercial vehicles for passenger and goods transport. Though the industry has been witnessing an impressive growth during previous years, the performance after 2006-07 has not been encouraging. The automobile sector recorded a growth of 13.6% in 2006-07. In 2007-08, the industry registered a negative growth rate of 2.3%. However, in 2008-09, the industry has witnessed a modest growth of 3.0%. While passenger vehicle, two-wheeler and three-wheeler registered a growth of 3.4%, 4.9% and 0.1% respectively; the utility vehicles and commercial vehicles segment registered a negative growth of 11.9% and 24.0% respectively. (Economic Survey 2008-09).
According to World Travel and Tourism Council, India will be the world's leading tourism hotspot, having the highest 10-year growth potential. The Travel & Tourism Competitiveness Report 2007 ranked tourism in India 6th in terms of price competitiveness and 39th in terms of safety and security.
India has a growing medical tourism sector. The 2010 Commonwealth Games in Delhi are expected to significantly boost tourism in India. The number of foreign tourist arriving in India up to 2006 has almost gone up thrice over the years (Chart D).
5.1 Further Expectations from Services Sector Though India is emerging gradually as a center of excellence in some specified service industries such as software, biotech, healthcare, and higher or technical education, there is a need to evolve robust quality systems and effective delivery mechanisms to be on par with the best in the world. The literacy rate from 45.0% in 1991 has reached to 61.0% in 2004 in rural areas, whereas, in urban areas it has posted a rise to 82.0% in 2004 against 73.0% in 1991. (Chart E).
The Indian IT industry, especially its software services sector has shown the way by its path-breaking dominance of the global technology market. Apart from driving employment generation, the service sector will be able to play a dominant role in activating the infrastructure and industrial sectors, as they are inter-dependant for the uniform growth of the economy. Agriculture’s contribution to the economy has been steadily declining from 1957-58 when it formed 51.2% of India’s GDP to 31.7% in 1987-88 and 17.8% in 2007-08. Services sector has increased from 30.9% in 1957-58 to 43.0% in 1987-88 and currently form about 55.7% of the GDP. As this transition from an agrarian to services focus is taking place, one can make a thought as how the two sectors could be optimised while leveraging the others’ resources. As of 2007, 273 million people were part of the agricultural workforce but there is a surplus of approximately 62 million workers in agriculture. If the excess 62 million workers could be absorbed by the services sector which in 2007 had 150 million employed, “even at the average productivity of services, their earnings would be more than in agriculture and in the process India’s GDP could rise by about 25%.” Agriculture while contributing $174 billion to India’s GDP employs a workforce of 273 million, whereas services contribute $500 billion but its workforce stands at 150 million. The services sector in the country has benefited from the availability of vast skilled labour. Furthermore, the growing knowledge-intensive services activities will require human resources equipped with appropriate skills. Hence, enhancement of skills of human resources at all levels, especially at higher levels of education, requires greater priority. In particular, demand for tertiary education is expected to increase significantly in the coming years. A renewed focus on developing high quality institutions of learning at all levels will be essential for India to benefit from its demographic advantage.
5.2 Limitations While output generation has shifted to services, employment creation in services has lagged far behind. India’s relatively jobless service sector growth is unlike the experience of other countries, where the service sector has also tended to gain a larger share of employment over time, (Table 3). The later Working Paper of IMF, “India’s Pattern of Development: What Happened, What Follows?” prepared by Kalpana Kochhar, Utsav Kumar, Raghuram Rajan, Arvind Subramanian, and Ioannis Tokatlidis in January 2006, indicated that though services in the aggregate has grown in all states, there seems to have been a noteworthy difference between services that are predominantly in the public sector and those that are in the private sector. The share of public sector services such as electricity, public administration, railways, and other community services is growing in the laggard states, while the share of private sector services such as business services (including software), real estate, and retail trade is growing in the fast-moving states. The important conclusion that emerges from analyzing the performance of the Indian states is that since 1980, despite the liberalization policies, India is actually veering further away from labor-intensive industries. Furthermore, there is no clear pattern of movement amongst fast-growing states towards these industries-instead, they seem to be moving into skill-intensive services. The share of the service sector in GDP has increased steadily over the years. But now, the structural change in the capital formation in favour of industry will probably help to raise the industry’s share too. The improvement in demand conditions and a sharp top line growth during the few years have led to a dramatic rise in industrial investment. Corporate India has gone on to increase production capacity to meet the growing demand. This is reflected in the changing pattern of fixed capital formation. The gross fixed capital formation in terms of industrial machinery and equipment in public, private and household sector over total gross fixed capital formation has increased by 7.7%, 29.5% and 9.3% respectively during 2007-08 as against a 15.4% rise in the aggregate fixed capital formation. Higher share of the service income in GDP may indicate prosperity, but the growth in earnings from trade, hotels and restaurants or for that matter from financing, insurance, real estate and business cannot be sustained unless industrial income grows proportionately to support their prosperity. Sectors like financial, healthcare and education have been in the public sector domain over the decades, driven by institutional or budgetary support, the huge fiscal deficit, interest burden, and international commitments have dried up government resources to expand the sector to meet the growing needs of a billion population. 6. Summing Up The service sector is clearly emerging as the new engine of economic growth. The sector needs to be geared up for improving the quality of life and play a greater role in the economic development.
* This note has been prepared by Ms Shruti J. Pandey References Various Media Sources IMF Working Paper, “Understanding India’s Services Revolution” (September 2004) IMF Working Paper, India’s Pattern of Development: What Happened, What Follows?” (January 2006) Ministry of Civil Aviation Government of India, Year End Review 2007. Society of Indian Automobile Manufacturers (SIAM) Government of India (GOI) Economic Survey 2008-09 Central Statistical Organisation (CSO), National Accounts Statistics 2009, www.mospi.nic.in Central Statistical Organisation, Statistical Abstract India 2007
Highlights of Current Economic Scene
Agriculture
In order to ensure availability of sufficient stock of sugarcane for current sowing season, Punjab Government has fixed the State Assured Price (SAP) of advanced, medium and late variety of Sugarcane at Rs 200, Rs 195 and Rs 190 per quintal for the crushing season of 2010-11. the crushing operations of sugarcane would be starting from 25 November for all the sugar mills and private gur manufacturers. The central government as on 19 October notified its decision to double the amount of sugar purchased from millers for distribution through ration shops in the 2009-10 season to protect the poor against high sweetener prices, which have threatened to touch Rs 40 a kg due to a slump recorded in output. The Genetic Engineering Approval Committee (GEAC) gave its nod to the environmental release of Bt Brinjal, the first genetically modified food crop. With this, Bt Brinjal is expected to be commercially launched in the country despite protests from environmental groups over health issues. The overall rice production in the country is likely to decline by around 12 million tonnes (MT) to 87 MT during the current kharif season as against 99 MT recorded during the corresponding period a year ago. Wheat stocks as on 1 October has augmented by 30% to 30.1 million tonnes while rice stocks stood to 15.05 million tones. Stock level of both the staple foodgrains (wheat and rice), has exceeded their buffer norm of 11 million tones of wheat and 5.2 million tones of rice, respectively. Rice procurement has declined by 22% to nearly 22 lakh tonnes so far in the current marketing season (2009-10) since the last week of September. This reduction in procurement level is due to low crop arrivals in the mandis. Arrivals of paddy crop is low as harvesting has not yet started in full swing because of delayed sowing. Exports of coir and its products from the country have registered a growth of 12.5% in quantity and 10.51% in terms of value during the period from April to September 2009 due to some revival in global export market. Exports touched to 1,10,470 tonnes valued at Rs 351.46 crore during the period as against 98,162 tonnes valued at Rs 318.02 crore recorded during the same period previous year. Coir mats has displayed a marginal decline of 2% while in value terms it registered a growth of 7% as compared to previous fiscal. A double digit growth of 10.4% in the index of industrial production has been witnessed during August 2009 over the index of August 2008. All the three major groups witnessed double digit growth mining and quarrying leading the way with an increase of 12.1% during the month. Other two groups manufacturing grew by 10.2% and electricity by 10.6%. Basic goods index rose by 10.0 per cent on the back of mining and quarrying and electricity growth. Capital goods growth was only 8.3% is a cause for concern. Consumer durable industries are the only group which recorded decline due to fall in the production of food products and beverage and tobacco products. Fourteen out of 17 industries registered positive growth during the month. The industry group rubber and plastic products, textile products, and wool, silk and man-made textile recorded substantial growth. Infrastructure The Index of Six core industries having a combined weight of 26.7 per cent in the Index of Industrial Production (IIP) with base 1993-94 rose substantially by 7.1 per cent in August 2009 as compared to 2.1% last year as a result the growth during the current financial year works out to be 4.8% as against a lower growth of 3.3% last year.. However crude oil registered a decline of 2.6%. Production of Petroleum refinery products and steel grew marginally during August 2009. Substantial increases have been witnessed in the production of Coal (12.9%), electricity (9.8%) and cement (17.6%). Inflation All commodities index registered a decline of 0.5% for the week ended October 3,2009 over the previous week and the annual inflation at this point works out to be 0.7% compared to 11.5% during the comparable period previous year. Substantial decline in food articles to the tune of 1.7% over the week was mainly due to fall in prices of many pulses and fruits and vegetables. Price decline witnessed in the groundnut seed and rape and mustard seed manifested it self in the price index of non-food articles which decline by 1.1% during the week under review. The decline of 0.1% in the price index of the major group fuel, power, light and lubricants is the result of a fall in aviation turbine fuel to the extent of 6% and furnace oil by 1%. Decline of 0.2% in the prices of manufactured products can be attributed to fall in prices iron ingots, lead ingots, zinc ingots. The final WPI for 8-8-2009 stood at 240.2 as compared to 237.4 resulting in the inflation rate exhibiting a decline of0.4 % instead of a decline of 1.5%. Financial Market Developments Primary Market The initial public offering (IPO) of Indiabulls Power, a subsidiary of Indiabulls Real Estate ended with 21.84 times oversubscription. The IPO garnered bids for 608.62 crore shares as against 27.86 crore shares on offer. The 39.07-crore issue, which opened on Monday, received bids for 165.6 crore shares. The anchor investors subscribed at Rs 45 a share. The price band for the issue was fixed at Rs 40-45. The issue will close on October 15. The company is looking to raise Rs 1,758 crore. Euro Multivision settled at Rs 53.20 on BSE on its debut, a discount of 29.06% over the initial public offer (IPO) price of Rs 75 per share. The stock debuted at Rs 70 on the BSE, a 6.66% discount over the issue price. The stock hit a high of Rs 80.90 and low of Rs 51.60. The counter clocked high volume of 2.07 crore shares on the BSE Secondary Market The market recouped most of the previous week's losses to close above the psychological levels of 17,000 for the barometer index the BSE Sensex and 5,000 for the NSE Nifty. News of a probable patch-up between the two Ambani brothers and a surprisingly strong industrial production numbers worked as a sentiment boosters. Strong global markets also lifted sentiments. The US Dow Jones index crossed the vital 10,000-mark, more than a year after getting clobbered by a sudden implosion of the financial system. The BSE Sensex rose 680 points or 4.09% to settle at 17,323 in the week ended Friday, 16 October 2009. The BSE Mid-Cap index jumped 307 points or 4.87% to 6,608 and the BSE Small-Cap index rose 295 points or 4% to 7,667. The NSE Nifty rose 197 points or 3.98% to 5,142 during the week. The BSE Sensex ended Samvat 2065 (the year according to the traditional Hindu calendar) with a gain of 8,813 points, or 104%, at 17,323 over Samvat 2064. The Samvat year 2066 started on a positive note on the bourses as the Sensex opened over 170 points higher but pared its gains on profit-taking and closed at 17,267 points, registering a loss of 56.19 points on Muhurat trading day. A special one-hour Muhurat trading was held on Saturday on the bourses to mark the beginning of the new Samvat year by the Hindu calendar. Trading commenced at 6.15 pm and closed at 7.15 pm. The NSE Nifty opened at a 52-week high of 5,159 and closed at 5,142 points. Derivatives In a bid to create more volumes by increasing arbitrage opportunities, the BSE has revamped its derivatives segment by changing the expiry cycle of futures and options (F&O). In response to inputs from market players and to improve liquidity in the F&O segment, the exchange has decided to change the expiry day of all monthly index futures and options from last Thursday of the month to the third-last Thursday of the month. Also, the expiry cycle of all weekly options contracts will be changed from Monday-Friday to Friday-Thursday. BSE is also introducing fortnightly contracts from next month. The cash market generated extraordinary volumes and saw net gains while the derivatives market displayed bullish sentiments and signs of decent carryover. There are also signs of traders bracing for settlement. There is significant open interest (OI) in November stock futures as well as in November index futures. The traded index futures and the majority of high-volume stock futures are, incidentally, at premiums to respective underlyings. The VIX is also low, at 26, which signals lack of fear. The put-call ratio (PCR) is extremely bullish with October Nifty PCR at 1.7 and overall Nifty PCR at 1.64. Government Securities Market Primary Market 91-day and 364-day Treasury Bills (TBs) were auctioned on 14 October 2009 with the total notified amount of Rs 9,000 crore. For 91-day TBs the notified amount has set at Rs 7,000 crore with cut-off-price and weighted average price of Rs 99.20 and yield to maturity (YTM) of 3.23%. For 364-day TBs the notified amount has kept at Rs 2,000 crore with cut-off-price and weighted average price have ended at Rs 98.02 and Rs 98.05, respectively and YTM of 4.05%. On 16 October 2009, RBI has issued 5-year security maturing on 2014 with the notified amount of Rs 3,000 crore and cut-off-yield of 7.32% and also re-issued 6.35% 2020 and 7.35% 2024 securities with the notified amount of Rs 4,000 crore and Rs 3,000 crore, respectively. The securities maturing in the year 2020 has cut-off-price of 89.14 and YTM of 7.92% while the securities maturing in the year 2024 has cut-off-price of Rs 91.58 and YTM of 8.35%. Primary dealers have bought 7.35% 2024 securities worth more Rs 210 crore. \Secondary Market During the week Rs 3,32,730 crore has been parked through 138 bids in the reverse repo recourse of LAF. Call rate has ranged between 3.20%-3.30% through out the week. On first day of the week it has remained around 3.30% and stayed constant at 3.25%-3.30%on third and fourth day but on the last day it has lingered almost at the same level between 3.20-3.30. Bond yields have been firmed ahead of the RBI peak season Credit Policy with mounting expectations of a credit impetus and the absence of large buyers such as insurance companies and provident fund during the week. Trading activity remained weak during the week and was evident in the trade volumes of barely Rs 3,500 crore per day. Yield spreads, of 1-year and 10-years government securities, has recorded at 259 basis points, as long-term yields hardened. Prices of bonds have declined on first day, with speculation that investors are demanding higher interest rates to absorb record supply of bonds from the government, as on Friday auction of government securities worth Rs 10,000 crore will be held and such kind of auctions on weekly basis has lined up till end of January to complete its record borrowing of Rs 4.51 crore in fiscal year 2009-10. Bond prices also have fallen after a government report showed industrial production rose the most in 22 months in August, adding to speculation the central will soon end its policy of keeping interest rates at record lows. Fall in price has stopped on the third day on the cues that government was not likely to wind up easy money policy by hiking interest rate. On the fourth day bond price gained marginally at the end of the trade after remained flat most part of the year and bond prices fall on the last day of the week because most investors preferred to trim holdings before the extended weekend. The 10-year benchmark bond, 6.90% 2019 has started week with fall in price at Rs 96.85 with YTM of 7.36% and closed on the last day of the week at Rs 96.54 wth YTM of 7.40%. Bond Market On 16 October 2009, the Securities and Exchange Board of India (Sebi) notified that clearing and settlement of trades in corporate bonds should be done through clearing corporations from 1 December 2009. This will be either through the National Securities Clearing Corporation (NSCCL) or the Indian Clearing Corporation (ICCL). So far, the NSE, BSE and the Fixed Income Money Market and Derivatives Association of India (FIMMDA) were authorised to set up and maintain reporting platforms to capture information related to trading in corporate bonds. During the week under review only one NBFC has issued bonds worth Rs 500 crore with the coupon rate of 8.55% for 15 years. The bond has been rated AAA (SO) by Icra. Foreign Exchange Market The rupee appreciated to Rs 46.27 (Rs 46.5) against the dollar. But the forward premia for one, three, six and 12 months hardened to 2.76 per cent (2.61 per cent), 3.11 per cent (2.90 per cent), 3.46 per cent (3.23 per cent) and 3.40 per cent (3.22 per cent) respectively, as importers, refiners and corporate took forward cover. Commodities Futures derivatives The commodity markets regulator, Forward Markets Commission (FMC), has asked commodity exchanges to work extensively on illiquid commodities to attract participation from traders, speculators and hedgers. D S Kolamkar, member, FMC, asked exchanges to change contract specifications in coordination with local market participants, if need arises. Commodity exchanges NCDEX and NMCE today said they would consider reducing transaction fee for their members, a move that comes after the country’s largest commodity bourse, MCX, decided to slash the charges. NCDEX, the second-largest exchange of the country, will seek market regulator Forward Market Commission’s (FMC’s) and stakeholders’ opinion before taking any decision. Last week, MCX reduced the transaction charge from Rs 4 to Rs 2.50 for every Rs 100,000 of turnover. This rate will be applicable for average daily turnover of up to Rs 250 crore. At present, NCDEX and NMCE charge Rs 4 for every Rs 100,000 turnover up to Rs 20 crore of average daily business. Insurance The Insurance Regulatory and Development Authority (IRDA) have decided to make available samples of transaction level data on motor and health insurance on its website to facilitate research on non-life insurance. LIC has increased its stake in Andhra Bank to 11.19% by buying 2.09% stake (10.14 million shares) of the bank. Bajaj Allianz Life insurance has posted a profit of Rs 125 crore during the second quarter of the fiscal year 2009-10, as compared to the loss of Rs 24 crore during the corresponding quarter of the previous fiscal year. IRDA is mulling to allow banks to tie-up with more than one and at most three insurance companies, as in existing scenario banks are not allowed to tie-up with more than one insurer. The regulator is currently reviewing the existing architecture of the of the bancassurance model and has set-up a seven member committee to study the subject. BankingThe RBI has extended the rupee export credit interest rate subvention facility to readymade garments along with textiles. Under this concession credit will be provided till 31 March 2009. Accordingly banks are advised to pass on this benefit to all eligible exporters in the readymade garment business. Private sector lender HDFC Bank is exploring the option of increasing its reach in the microfinance segment through tying-up with the postal service department and is in talks with it for the same. The India Post has already tied-up with NABARD for extending microcredit in Tamil Nadu. HDFC Bank is keen to use the wide network of more than 1.5 lakh post offices across the country (more than twice the number of all the branches of the entire banking system). Net profit of Bajaj Auto Finance has jumped more than four-fold to Rs 22 crore for the second quarter of financial year 2009-10 over the same period of last fiscal year, while the total income has reached at Rs 219 crore in the second quarter of fiscal year 2009-10, against Rs 137 crore in the same period in the previous fiscal year. Central Bank of India, with no exposure to overseas market, is exploring the possibility of opening branches in Hong Kong and London along with other countries. The RBI has cancelled the certificates of registration granted to Peekod Finance Company Private Ltd, Sqarn Fivest Private Ltd, Utkarsh Finvest Private Ltd, for carrying on the business of a non-banking financial institution. Following cancellation of the registration certificate the companies cannot transact the business of a non-banking financial institution. Corporate Pharma company Ipca is planning to set up a new formulation facility in Sikkim at an investment of around Rs 60 crore. Kumar Mangalam Birla-led Aditya Birla Group plans to invest over Rs 4,000 crore in future technologies by setting up a Knowledge Park and a branch of the Birla Institute of Technology and Sciences (BITS) at Kozhikode in Kerala. The government is considering at withdrawing capital gains tax that is levied when unlisted companies convert to limited liability partnerships (LLPs) once the new business vehicle finds acceptance in the country. The Foreign Investment Promotion Board (FIPB) has approved debt-ridden Jet Airways’ plans to raise $400 million (about Rs 2,000 crore) through sale of fresh shares to qualified foreign institutions; however the company requires the Union Cabinet’s clearance to go ahead. External Sector Exports during August 2009 at US $14289 million were 19.4% lower than that of US$ 17734 million last year. Cumulative value of exports for the period April-August, 2009 was US$ 64129 million as against US$ 92959 million, a negative growth of 31% over the same period last year. Imports during August, 2009 were valued at US $ 22661 million representing a decrease of 32.4% over the level of imports valued at US $ 33512 million in 2008. Cumulative value of imports for the period April-Aug 2009 was US$ 102300 million as against US$ 153691 million registering a decline of 33.4%. Oil imports during at US $ 6281 million was lower by 45.5% over the year. Oil imports during April-Aug, 2009 valued at US$ 28275 million which was 47.4% lower than the oil imports of US $ 53742 million in the corresponding period of the previous year. Non-oil imports during August, 2009 were estimated at US $16380 million was lower by US $ 5611 million over the August 2008 level. Non-oil imports during April-August, 2009 were valued at US$ 74024 million which was 25.9% lower than the level of such imports valued at US$ 99949 million in April-Aug, 2008. The trade deficit for April- August, 2009 was estimated at US $ 38171 million which was lower than the deficit of US$ 60732 million during April-August, 2008. Information TechnologyTargeting small and medium enterprises in India, IBM has come up with a new marketing imitative, ‘Blue Button’, designed to guide SMEs to buy IT with solutions (across hardware, software, services and consultation) to solve their business problems in real time. TelecomUAE-based handset manufacturer, Spark Mobiles will foray into the Indian market by the end of this year and has earmarked a marketing budget of more than Rs 100 crore to be spent over the next two years. In an attempt to improve telecom services in rural areas, state-owned BSNL would set up about 10,000 towers across the country, many of which would be installed in villages bordering Bangladesh and Pakistan. The would strengthen the existing communication system in the rural areas, while using state-of-the-art technology to check interference from a foreign telecom network. Telecom service providers are allowed to install towers to receive signals within 500 metres near the international border.
*These statistics and the accompanying review are a product arising from the work undertaken under the joint ICICI research centre.org-EPWRF Data Base Project. | ||||||||||||||||||||||||||||||||||||||||||||||||||||||||||||||||||||||||||||||||||||||||||||||||||||||||||||||||||||||||||||||
|
We will be grateful if you could kindly send us your feed back at epwrf@vsnl.com | ||||||||||||||||||||||||||||||||||||||||||||||||||||||||||||||||||||||||||||||||||||||||||||||||||||||||||||||||||||||||||||||
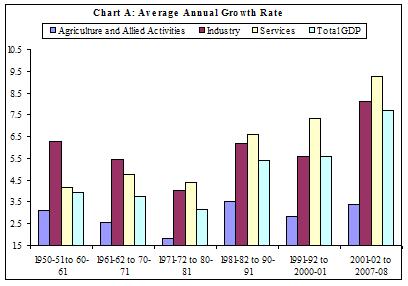 Though
the average annual growth rate of agriculture sector had never been very
high, as compared to industrial and services sectors over the decades,
agricultural sector has managed to maintain its average growth of about
3.4% for the period 2001-02 to 2007-08, against a growth of 3.1% in
1950-51 to 1960-61. In the interregnum, after registering a lowest average
growth of 1.8% during the period 1971-72 to 1980-81, agriculture and
allied activities posted a growth of 3.5% for the period 1981-82 to
1990-91. The period 1981-82 to 1990-91 represented a structural break, as
during this phase, the total GDP of the economy reached a higher growth
trajectory of 6.2% from its earlier Hindu growth rate of about 3.5-4.0 %.
From this period onward, significant growth has been witnessed in both
services and industrial sectors. The average annual growth in industrial
sector showed a cyclical pattern. After slowing down from 6.3% in 1950s,
to 4.0% in 1970s, it gained momentum in 1980’s to 6.2%, but the 1990s
witnessed a dip to 5.6%. The current decade saw the highest average annual
growth of 8.1%. The services sector showed consistent improvements since
1950s but for a dip during 1970s and the current decade represents really
an accelerating trend in services sector growth. (Chart A).
Though
the average annual growth rate of agriculture sector had never been very
high, as compared to industrial and services sectors over the decades,
agricultural sector has managed to maintain its average growth of about
3.4% for the period 2001-02 to 2007-08, against a growth of 3.1% in
1950-51 to 1960-61. In the interregnum, after registering a lowest average
growth of 1.8% during the period 1971-72 to 1980-81, agriculture and
allied activities posted a growth of 3.5% for the period 1981-82 to
1990-91. The period 1981-82 to 1990-91 represented a structural break, as
during this phase, the total GDP of the economy reached a higher growth
trajectory of 6.2% from its earlier Hindu growth rate of about 3.5-4.0 %.
From this period onward, significant growth has been witnessed in both
services and industrial sectors. The average annual growth in industrial
sector showed a cyclical pattern. After slowing down from 6.3% in 1950s,
to 4.0% in 1970s, it gained momentum in 1980’s to 6.2%, but the 1990s
witnessed a dip to 5.6%. The current decade saw the highest average annual
growth of 8.1%. The services sector showed consistent improvements since
1950s but for a dip during 1970s and the current decade represents really
an accelerating trend in services sector growth. (Chart A). 
 India
is fast becoming a major force in the Information Technology sector.
According to the National Association of Software and Service Companies (NASSCOM),
over 185 Fortune 500 companies use Indian software services. The world's
software giants such as Microsoft, Hughes and Computer Associates who have
made substantial investments in India are increasingly tapping this
potential. A number of multi-nationals have leveraged the relative cost
advantage and highly skilled manpower base available in India, and have
established shared services and call centers in India to cater to their
worldwide needs.
India
is fast becoming a major force in the Information Technology sector.
According to the National Association of Software and Service Companies (NASSCOM),
over 185 Fortune 500 companies use Indian software services. The world's
software giants such as Microsoft, Hughes and Computer Associates who have
made substantial investments in India are increasingly tapping this
potential. A number of multi-nationals have leveraged the relative cost
advantage and highly skilled manpower base available in India, and have
established shared services and call centers in India to cater to their
worldwide needs.  Tourism
is the largest service industry in India, with a contribution of 6.2% to
GDP and providing 8. 8% of the total employment in India. India witnesses
more than 527 million domestic tourism visits. The tourism industry in
India generated about US $100 billion in 2008. The Ministry of Tourism is
the nodal agency for the development and promotion of tourism in India. It
maintains the "Incredible India" campaign.
Tourism
is the largest service industry in India, with a contribution of 6.2% to
GDP and providing 8. 8% of the total employment in India. India witnesses
more than 527 million domestic tourism visits. The tourism industry in
India generated about US $100 billion in 2008. The Ministry of Tourism is
the nodal agency for the development and promotion of tourism in India. It
maintains the "Incredible India" campaign.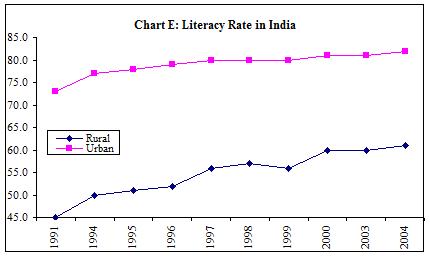 If
the service sector has to drive the GDP growth rate and increase its share
to the world average of 60-65%, its vertical segments have to tap the
global market aggressively, taking advantage of the low-cost operations,
wealth of talent pool, and the domain knowledge of these emerging
technologies.
If
the service sector has to drive the GDP growth rate and increase its share
to the world average of 60-65%, its vertical segments have to tap the
global market aggressively, taking advantage of the low-cost operations,
wealth of talent pool, and the domain knowledge of these emerging
technologies.