Current Economic Statistics and Review For the
Week
Ended July 15, 2006
Theme
of the week:
Carbon Trading: A Step Towards Cleaner Environment*
Introduction
In the last few decades, the world has witnessed frequent catastrophes, such as severe droughts, heavy rain cycles, cloudburst, longer and more extreme heat waves, threats to coastlines and property due to surge in storms and higher sea levels as a result of more ice melting and going into the sea. Though occurrence of floods, drought, storms and other extreme weather conditions have always been a reality, but their incident has been rare, interrupting long period of calm, in other words weather patterns have remained relatively constant. However, the frequency of extreme weather events has increased steadily over the 20th century. The number of weather-related disasters during 1990s was four times that of 1950s and cost 14 times higher in terms of economic losses. This increased occurrence of extreme weather conditions across the globe points towards a dangerous threat – climate change.
Global Warming and Climate Change
Climate change is an issue that threatens the entire globe. Broadly, climate change refers to variation in the earth’s climate or regional climate over time. It describes changes in the variability or average state of the atmosphere - or average weather - over time scales ranging from decades to millions of years. These changes may come from internal processes, be driven by external forces or, most recently, be caused by human activity. In recent usage, especially in the context of environmental policy the term "climate change" is often used to refer only to the ongoing changes in modern climate, including the average rise in surface temperature known as global warming. Overwhelmingly scientific evidences indicate that world is warming up and there is observed increase in the average temperature of the Earth’s atmosphere and oceans in recent decades. According to the findings of Intergovernmental Panel on Climate Change (IPCC)[1], the global average surface temperature has increased by 0.6 per cent over the course of 20th century. Scientists have recorded 1990s as the hottest decade witnessed since the industrial revolution began. As a result of global warming, the extent of snow has decreased by about 10 per cent since 1960s, while mountain glaciers have retreated rapidly. The global average sea level has risen by 10 to 20 cm during the 20th century and the amount of heat stored in the oceans has measurably increased since observations began in the 1950s. Rainfall patterns also appear to be changed. El Nino (which causes drought and flooding) phenomenon has become more frequent, intense and persistent since the mid-1970s than during the previous 100 years. Thus global warming is causing fundamental changes in the Earth’s climate system and there is enough scientific evidence to prove that it is human induced. IPCC’s Third Assessment Report also strengthens the conclusion that most of the warming observed during the last 50 years is attributable to human activities. The increased amounts of carbon dioxide and other greenhouse gases[2] are the primary cause of human-induced climate change. A rapid rise in the concentration of greenhouse gases in the atmosphere has been caused by rising industrial activity resulting in fossil fuel[3] combustion and deforestation. In fact, burning of fossil fuels is the largest source of emission of carbon dioxide, which is identified as the single most important factor contributing to global warming. Since climate change can have grave ecological consequences, this situation calls for serious and persistent efforts towards reducing the emission of greenhouse gases, particularly carbon dioxide.
Global
Governance of Climate Change
Climate
change negotiations started more than two decades ago and the first formal
step in this direction was signing of a global Framework Convention on
Climate Change (FCCC) under the auspice of United Nations. The
United Nations Framework Convention on Climate Change (UNFCCC or FCCC) is an
international environmental treaty on climate change produced at the United
Nations Conference on Environment and Development (UNCED), informally known
as Earth Summit, held in
The
The Kyoto Protocol is an agreement made under the United Nations Framework Convention on Climate Change (UNFCCC) intended to cut global emission of greenhouse gases and countries that ratify this protocol commit to reduce their emissions of carbon dioxide and five other greenhouse gases or engage in emission trading if they increase or fail to reduce the emissions. The objective of UNFCCC is the “stabilisation of greenhouse gas concentrations in the atmosphere at a level that would prevent dangerous anthropogenic[4] interference with the climate system”. According to a press release from the United Nations Environment Programme “The Kyoto Protocol is an agreement under which industrialised countries will reduce their collective emissions of greenhouse gases by 5.2 per cent compared to the year 1990 (but note that, compared to the emissions levels that would be expected by 2010 without the Protocol, this target represents a 29 per cent cut). The goal is to lower overall emissions of six greenhouse gases – carbon dioxide, methane, nitrous oxide, sulfur hexafluoride, HFCs and PFCs – calculated as an average over the five-year period of 2008-12. National targets range from 8per cent reductions for the European Union and some others to 7per cent for the US, 6 per cent for Japan, 0 per cent for Russia, and permitted increases of 8 per cent for Australia and 10 per cent for Iceland.”. The Kyoto Protocol sets out (in Annex B) a range of legally binding greenhouse gas emission commitments (targets) for individual developed countries (also called Annex-I countries), designed to reduce overall greenhouse gas emissions and thus help meet the UNFCCC’s objective.
The
treaty (Kyoto Protocol) was negotiated in December 1997 but the agreement
came into force only on February 16 2005[5].
As of April 2006, a total of 163 countries have ratified the agreement
(representing over 61.6 per cent of emissions from Annex-1 countries).
Almost all the developed countries with the exception of the
To
achieve the required above-mentioned reduction goal in a cost effective way[6]
the Protocol provides three mechanisims to the developed nations.
Joint Implementation (JI) projects
which reduce emissions within industrialised countries,
: The Kyoto Protocol
provides for developed countries to implement projects that reduce
emissions, or remove carbon from the atmosphere in other developed countries
and earn Emission Reduction Units (ERUs). These ERUs can be used to meet the
emission reduction targets. A JI project might involve, for example,
replacing a coal-fired power plant with a more efficient combined heat and
power plant or for example, if a Japanese company invests in an emissions
reduction project in Russia (for example, retrofitting coal-fired power
plants to burn natural gas) then the credits for the emissions avoided could
be allocated to the Japanese company (these credits are known as 'Emission
Reduction Units', or ERUs and are equal to one metric tonne of carbon
dioxide equivalent, or CO2 eq).
Clean Development Mechanism: is the only
mechanism under the Kyoto Protocol involving countries that are not subject
to binding greenhouse gas emission caps by the protocol – so-called
non-Annex I countries. The CDM provides for developed countries to implement
project activities that reduce emissions in developing countries in return
for certified emission reductions (CERs). The CERs generated by such project
activities can be used by developed countries to help meet their emission
targets under the Protocol. In exchange, developing country parties will
have access to resources and technology to assist in development of their
economies in a sustainable manner. A CDM project activity might involve, for
example, a rural electrification project using solar panels or the
installation of more energy efficient boilers.
International Emissions Trading (IET):
International Emissions Trading of assigned amount
units (AAUs) allows Annex B parties (countries with binding commitments) to
exchange emissions reductions or to trade AAUs via a
cap-and-trade[7]
system to meet their Kyoto targets. An allocation of emissions
allowances to each of the Annex I parties has been proposed under the Kyoto
Protocol. Each Annex I party is given an allowance known as an
"assigned amount". The assigned amount for any Annex I party can
be calculated from its emissions reduction target specified under Annex B of
the Kyoto Protocol. For example, the "assigned amount" for
At the end of the commitment period, a country is declared in compliance with its emission commitment if its emissions are less than or equal to its assigned amount adjusted for emission trading, JI and CDM transactions.
Carbon
Trading
Carbon
trading, or more generically emissions trading, is the term applied to the
trading of certificates representing various ways in which carbon-related
emissions reduction targets might be met. Participants in carbon trading buy
and sell contractual commitments or certificates that represent specified
amounts of carbon-related emissions that either:
-
are allowed to be emitted;
-
comprise reductions in emissions (new technology, energy efficiency, renewable energy); or
-
comprise offsets against emissions, such as carbon sequestration[9] (capture of carbon in biomass).
Carbon
credits were one of the outcomes of the Kyoto Protocol. They are a measure
devised by the Kyoto Protocol to reduce world Greenhouse Gas emissions, and
hence fight climate change. For each tonne of carbon dioxide that is saved
or sequestered carbon credit producers may sell one carbon credit. Or in
other words, each carbon credit represents one tonne of carbon dioxide
either removed from the atmosphere or saved from being emitted
People
buy and sell such products because it is the most cost-effective way to
achieve an overall reduction in the level of emissions, assuming that
transaction costs involved in market participation are kept at reasonable
levels. Countries/companies with high internal emission
reduction costs would be expected to buy certificates from
countries/companies with low internal emission reduction costs. The latter
entities would also be expected to maximise their production of low cost
emission reduction so as to maximise their ability to sell certificates to
high cost entities.
The
idea behind Carbon Trading was to make developed countries pay for their
wild ways with emissions while at the same time monetarily rewarding
countries with good behaviour in this regard. Since developing countries can
start with clean technologies, they will be rewarded by those stuck with
‘dirty’ ones.
Of
late, multilateral development banks such as World Bank and the ADB have
been taking keen interest in carbon market. Over the past five years the
World Bank, the ADB, the African Development Bank, European Development Bank
and the Inter-American Development Bank have invested over $17 billion in
projects that directly or indirectly contribute to lowering carbon emission
in developing countries. Both the World Bank and ADB now manage carbon funds
worth close to $5 billion.
Need
for Carbon equivalents
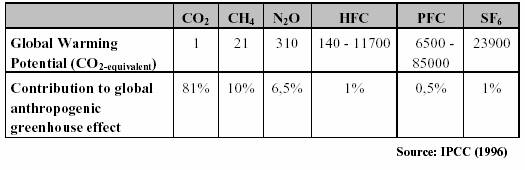
Carbon dioxide equivalents (CO2e) provide a universal standard of measurement against which the impacts of releasing (or avoiding the release of) different greenhouse gases can be evaluated. Every greenhouse gas has a Global Warming Potential (GWP), a measurement of the impact that particular gas has on 'radiative forcing'; that is, the additional heat/energy which is retained in the Earth's ecosystem through the addition of this gas to the atmosphere. The GWP of a given gas describes its effect on climate change relative to a similar amount of carbon dioxide and is divided into a three-part "time horizon" of twenty, one hundred, and five hundred years. As the base unit, carbon dioxide numeric is 1.0 across each time horizon. This allows the greenhouse gases regulated under the Kyoto Protocol to be converted to the common unit of CO2 eq.
Global
Warming potentials for the greenhouse gases regulated under the Kyoto
Protocol under a 100-year timeframe are as follows:![]()
Domestic
Emission Trading Schemes
With
the signing of the Kyoto Protocol different Countries and/or
European
Union Emission Trading Scheme (EU ETS)
The
ETS was established primarily to help EU member states achieve their Kyoto
Protocol targets, as well as providing companies and governments with
experience in developing, operating and participating in carbon markets. The
first phase of the EU ETS will run from 2005 to 2007, with a second phase
from 2008 to 2012 (when other greenhouse gases besides CO2 may be added).
Further five-year periods are expected to be subsequently established.
Five
sectors are explicitly covered by the scheme: electricity generation, pulp
and paper, oil refineries, building materials (such as cement, glass, etc.)
and ferrous metals. Overall, more than 12,000 individual installations will
be regulated, accounting for about 45 per cent of all EU greenhouse gas
emissions.
The
scheme should allow the EU to achieve its
The
European Union Emissions Trading Scheme (EU ETS) became effective from
January 1st 2005, creating the world's largest market in greenhouse gas
emissions. The program establishes a mandatory carbon dioxide cap-and-trade
system, in which sources are allocated a certain number of emission
"allowances", based on historic performance and other parameters.
Specific
emissions targets are being established by national governments in the form
of National Allocation Plans (NAPs), which specify how many allowances will
be awarded to emitters in each regulated industry. These NAPs were expected
be finalised during 2005 before being approved and policed by the European
Commission.
Participants
reducing emissions below their cap can sell the resulting excess allowances.
On the other hand, those companies which find reducing emissions internally
to be prohibitively expensive, or those needing to increase production, can
buy allowances in the open market.
If
a participant is not able to surrender sufficient allowances to cover its
annual emissions by the reconciliation date, it will be financially
penalised (€ 40/tCO2 for the first phase and € 100/tCO2 for the second
phase). All 25-member states of the European Union are involved in the EU
ETS.
The
first two months of 2005 saw more than 14 million tCO2 traded in the
brokered market, which is more than was traded during all of 2004. At prices
ranging from about € 6.50 to € 9.50 per tCO2, the market activity in
January and February accounted for a combined total of over $100 million.
Point Carbon predicts that the EU ETS will transact around €16 billion in
2010, accounting for almost half of the entire global carbon market, with
some 1,700 million tCO2e being traded in the scheme.
California
Climate Change Register
The
California Climate Action Registry (the Registry) was established by
The
Registry encourages voluntary actions to increase energy efficiency and
decrease GHG emissions. Using any year from 1990 forward as a base year,
participants can record their GHG emissions inventory. The State of
The
Registry has developed a General Protocol and additional industry-specific
protocols which give guidance on how to inventory GHG emissions for
participation in the Registry: what to measure, how to measure, the back-up
data required, and certification requirements. When organizations become
participants, they agree to register their GHG emissions for all operations
in
The
Registry requires the reporting of only CO2 emissions for the first three
years of participation, although participants are encouraged to report the
remaining five GHGs covered in the
Chigaco
Climate Exchange (CCX)
Chicago Climate Exchange is a self-regulatory exchange that administers the world's first multi-national and multi-sector marketplace for reducing and trading greenhouse gas emissions. CCX represents the first voluntary, legally-binding commitment by a cross-section of North American corporations, municipalities and other institutions to establish a rules-based market for reducing greenhouse gases. The members of CCX have made a voluntary, legally-binding commitment to reduce their emissions of greenhouse gases (CO2, CH4, N2O, PFCs, HFCs, SF6) by four percent below the average of their 1998-2001 emissions baseline by 2006. Each Member can meet their commitment through internal reductions, by purchasing allowances from other Members, or by purchasing credits from emission reductions projects. Eligible offset project categories are: landfill and agricultural methane capture, carbon sequestration in soils, and carbon sequestration in forest biomass.
The CCX's Members, as of March 2005, are: Rolls-Royce, Ford Motor Company, Dow Corning, DuPont, Bayer Corporation, Interface, American Electric Power, Green Mountain Power, Manitoba Hydro, TECO Energy, Motorola, Waste Management, Premium Standard Farms, International Paper, Mead Westvaco, Stora Enso North America, Temple-Inland, IBM, City of Chicago, Baxter Healthcare Corporation, Tufts University, The University of Iowa, The University of Oklahoma, ST Microelectronics, Roanoke Electric Steel, and Amtrak.
Trading activity and prices per tonne have been growing steadily. 2,250,000 tCO2e, valued at about $2 million, was traded through the CCX during 2004. During that period, prices ranged from $0.71 to $2.06 per tCO2e, with most trades occurring around $1 per tonne. These prices are much lower than those found in the regulated carbon markets, such as the EU ETS, NSW, in part because the CCX is voluntary and also because of the large volume of inexpensive agricultural sequestration offsets being offered, which would not be permitted under the other schemes.
The
New South Wales (NSW) Greenhouse Gas Abatement Scheme, commenced on January
1st 2003 and remains in force until 2012, unless extended. In order to abate
the emissions of greenhouse gases associated with electricity consumption in
The scheme seeks to reduce greenhouse gas emissions from the NSW electricity sector by 5 per cent per capita between 2003 and 2007, and then maintain the reduced level until at least 2012. This creates an estimated potential market of over 10 million tCO2e in offsets by 2005, rising to 20 million tones by 2012.
The Scheme includes a penalty of AU$10.50 per tonne of excess CO2 emissions over the benchmarks. However, since the penalties are not tax deductible, but offset purchases are, the effective price could be as high as AU$15/tCO2e. The penalty rate will subsequently be adjusted by the Consumer Price Index.
About
two dozen NSW energy providers are regulated under the scheme (including
Energy
As of February 2005, over 10 million greenhouse abatement certificates have been registered in just over two years of the Scheme's operation. During 2004, more than fifty separate deals traded 5 million certificates, with prices ranging from ~AU$10 to AU$14 per tCO2e, depending on their vintage.
The
UK Emissions Trading Scheme commenced in April 2002, and was the first
cross-industry, national greenhouse gas emissions trading scheme in the
world. Under the scheme, companies could chose to enter the scheme either
through a timed auction as a direct participant with absolute targets, as 34
companies chose to do, or through Climate Change Levy Agreements (CCAs)
The
Market for Carbon Trading
Data
on carbon trading is available since 1998 and according to the statistics
available the total volume of carbon credits traded have increased from
close to 18mn tons of CO2 equivalent in 1998 to around 107mn tons of CO2
equivalent in 2004. In 2005 the volumes have already reached levels of 43mn
tons of CO2 equivalent. Out of the total volumes
traded in 2005, more than 92 per cent was on account of compliance with the
Kyoto Protocol and only close to 7 per cent was on voluntary basis.
The
buying side of the market is primarily dominated by European countries and
The
seller’s side is dominated by
Pricing
Pricing
is highly dependant on the characteristics of individual markets. Key
factors include:
- International
and domestic policy risk (uncertainty);
·
![]() The
recognition of monitoring and verification protocols;
The
recognition of monitoring and verification protocols;
·
![]() The
recognition of early credit;
The
recognition of early credit;
·
![]() Expected
versus actual allocation;
Expected
versus actual allocation;
- Delivery
risk (project financial and operational risk);
·
![]() Country
risk; and
Country
risk; and
·
![]() Sustainability
and wider social impact of the underlying project.
Sustainability
and wider social impact of the underlying project.
The price for a carbon credit ranges between €5 and € 20, depending on the stage of approval process. For projects at pre-registration stage, the price is lower. But those where credits have already been issued command a premium.
Transactions range from simple purchases and sales to structured options transactions. Basic structures include:
Immediate Settlement (Spot) trades are trades where the terms of a bid and offer are set on the trade date with delivery and payment occurring in a standard timeframe shortly thereafter.
Forward Settlement trades resemble immediate settlement trades, with the difference being that terms are again set on the trade date, but delivery of reductions and payment are deferred to a future date also specified at the time of trade.
Options are derivative products in which the parties buy or sell the option, or right decided, whether or not to enter into a specified cash transaction at (or before) a future date, referred to as the strike date. The most common types of options are call options and put options, though there are many other forms. Call options allow a buyer to lock in the right to purchase reductions at a specified date at a specified price. Put options allow a seller to lock in the right to sell reductions at a set price.
Examples of global companies that have taken initiatives to reduce emissions
·
American
Electric Power
is investing in renewable energy
projects in
- Florida
Power and Light invested
in 42 wind facilities and energy efficiency, eliminating the need to
build 10 power plants.
- General
Electric purchased
Enron’s wind business and a solar energy company; doing research on
earth-friendly hydrogen and lower emission jet engines and locomotives.
- General
Motors is in the process
of developing hydrogen-powered cars that don’t emit CO2.
While
carbon trading promises almost free money, there are certain uncertanities
involved in the mechanism. Part of this uncertanity in the market stems from
the fact that the
CDM,
which is the only mechanism available to developing countries, has evoked a
tremendous amount of interest in
For
the first time, as per the Kyoto Protocol, ![]()
|
Table
1: Companies with Carbon Credit Trading Plans |
|||||
|
Company |
Green
Project |
Technology |
Project
Status |
Scale
of |
Expected
|
|
|
|
|
|
emissions |
annual
inflow |
|
GFL |
destruction
of waste |
installation
of |
CER
registration |
33.9
lakh CERs |
Rs
88.1 crore |
|
|
product
HFC23 through |
thermal
oxidation |
done. |
or
carbon credits |
|
|
|
incineration.
I tonne of |
equipment
via |
|
|
|
|
|
HFC23
has warming |
technology
partner |
|
|
|
|
|
potential
of 11700 tonnes |
UK-based
Ineos |
|
|
|
|
|
of
CO2 |
Technology. |
|
|
|
|
SRF |
Thermal
oxidation of |
Thermal
oxidation |
Approved.
Has |
38
lakh CERs |
in
excess of |
|
|
HFC23
|
technology
provider |
already
sold some |
a
year |
Rs
95 crore. |
|
|
|
is
Solvo Fluor |
CERs
accrued |
|
|
|
|
|
|
during
2005-06 |
|
|
|
Shree
|
Three
projects involving |
Developed
largly |
at
various stages |
1
lakh CERs |
Rs
10 crore |
|
Cements |
bio-fules
for pyro-proce |
in-house |
but
the biomass |
per
year |
per
annum |
|
|
-ssing
in cement plant; |
|
one
is already |
|
|
|
|
reduction
in clinker |
|
registered. |
|
|
|
|
content
by increased |
|
|
|
|
|
|
fly
ash content; waste |
|
|
|
|
|
|
heat
recovery based |
|
|
|
|
|
|
power
plant. |
|
|
|
|
|
Triveni |
Bagasse-based
power |
Developed
largly |
Validation
stage |
1.6
to 2 lakhs |
has
been revised |
|
Engineering |
generation
plants. |
in-house |
|
CERs |
upwards
from |
|
|
|
|
|
|
Rs
4.2 crore to |
|
|
|
|
|
|
Rs
16 crore |
|
Balrampur |
Bagasse-based
power |
Developed
largly |
Validation
process |
1.8
lakh CERs |
Around
Rs 5 crore |
|
Chini |
generation
plants. |
in-house |
is
still on but it has |
|
|
|
|
|
|
already
sold a small |
|
|
|
|
|
|
fraction
of its CERs |
|
|
|
|
|
|
to
IFC. |
|
|
|
Source:
Business Today, 2006 |
|
|
|
|
|
India
is beginning to experience the first flow of money from the carbon market
.CDM projects set up by Indian industry are expected to generate over 155
million CERs until 2012, based on projects that were approved by Indian
authorities until November 2005. Of these, CERs generated by “industrial
process” methodologies are in the forefront and account for about half the
expected output. Several Indian
companies that are implementing CDM projects are thought to have agreements
to deliver CERs at various stages during the 2008-12 period, for around euro
15/CER (US $ 17.5 at current rates). Karnataka, Andhra Pradesh, Rajasthan
and Tamil Nadu have emerged as the most active host states in the country.
To
facilitate this trading, The World Bank has set up the Prototype Carbon Fund
for unhindered flow of capital between developed and developing countries,
where the Bank will act as a mediator in the buying and selling of carbon
credits. The World Bank has signed an agreement with the IDFC
(Infrastructure Development Finance Company) on 21 October 2002 to handle
carbon finance facilities worth US$ 10 million. The money received by the
Bank will be further invested through local banks or institutions like IDFC
for renewable technologies in
The
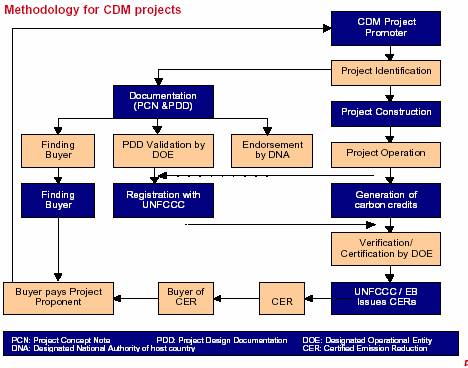
institutional setting concerning CDM approval in
The
CDM goes through different stages of project identification: host country
endorsement, development of baseline emission data, validation by an
independent agency, registration with the Executive Board for CDM,
independent monitoring of the actual emission reductions, and verification.
The end of the process is the certification of emission reductions, which
can then be traded. Following flow chart explains the methodology.
Case
Against CDM
The
CDM clearly has some immediate and apparent benefits – it brings cleaner
technologies and provides financing to projects in developing countries.
However, according to critics the system, as currently proposed is no more
than a way for wealthy nations to buy their way out of their emission
reduction obligations without significantly reducing domestic emissions.
These markets do not create right condition for the structural change needed
to tackle global warming. Some critics have voiced that the issue of climate
change is being commercialised. According to Mr Gopal Krishna, Coordinator
of Toxics Link, a Delhi-based NGO says, "It is a pity that we are
twisting the basic issue of CDM in the Kyoto Protocol into a profit-making
machine". He adds, "The very seriousness of an issue as pertinent
as climate change is being diluted by such trading. Countries like
Opposition
to
The two
major countries currently opposed to the treaty are the
Further,
there is a controversy to use 1990 as a base year, or not to use a per
capita emission as a basis. Countries had different achievements in energy
efficiency in 1990. For example, the former Soviet Union and eastern
European countries did little to tackle the problem and their energy
efficiency was at their worst level in 1990 as the year was just before
their structual change, on the other hand Japan as a big importer of natural
resources had to improve their efficiency after the 1973 oil crisis and
their emission level in 1990 was better than most developed countries.
Also,
economists have been trying to analyse the overall net benefit of Kyoto
Protocol through cost-benefit analysis. But, there is disagreement due to
large uncertainties in economic variables. Still, the estimates so far
generally indicate either that observing the Kyoto Protocol is more
expensive than the not observing the Kyoto Protocol or that the Kyoto
Protocol has a marginal net benefit which exceeds the cost of simply
adjusting to global warming.
Conclusion
Climate
change is an issue which threatens the entire globe and climate
stabilisation requires tremendous changes in the way energy is produced and
consumed. The aim is to have a cleaner environment by limiting the emission
of various greenhouse gases.
Nevertheless,
emissions trading offers a major opportunity to help achieve the ultimate
objective of the UNFCC Convention. Emissions trading systems that are both
environmentally effective and cost-effective also offer an important policy
advantage by allowing for acceptable negotiated outcomes at a global level.
However, they need some refinements to better deal with the deep and
long-lasting uncertainties on abatement costs and technology developments
over a century or more and the policy concerns these uncertainties raise.
Thus, International emission trading is full of promise. But difficult political and technical issues remain to be faced. If they are successfully resolved, the world will have gained a new and very effective way of combating climate change.
References
Aditi
Sen (2006), “Hotting up: the science and politics of climate change” Agenda
issue no 5.
Butzengeir
Sonja et al (2001), “ Making GHG emission trading work – critical
issues in designing national and international emission trading systems”
HWWA discussion paper no 154, Hamburg Institute of International Economics.
India
Infoline (2005), “Carbon Credits – Emitting gains”, July.
Rahul
Goswami (2006), “A trading system based on hot air” Agenda issue
no 5.
Shalini.S.Dagar
(2006), “Money from thin air” Business Today, May 7.
Various Media Sources
http://ieta.org/ieta/www/pages/index.php
(* This note
is prepared by Abhilasha Maheshwari)
[1] The IPCC was established in 1988 by two United Nations organisations namely World Meteorological Organisation (WMO) and United Nations Environment Programme (UNEP) to assess the risk of human - induced climate change.
[2]
99 per cent of the earth’s atmosphere consists of nitrogen (78 per
cent) and oxygen (21 per cent). Both of these gases are responsible for
complex biogeochemical cycles that support life on the planet, but they
play little direct role in regulating climate. The remaining 1 per cent
is made up of small amounts of ‘trace’ gases like argon, water
vapour, carbon dioxide, nitrous oxide, methane, chlorofluorocarbons
(CFCs) and ozone – all of which are important in the regulation of
climate. These trace gases are known as greenhouse or radiatively active
gases (those that absorb or reflect infrared radiation)
[3] Fossil fuels, also known as mineral fuels, are hydrocarbon-containing natural resources such as coal, oil and natural gas.
[4]
Anthropogenic effects or processes are those
that are derived from human activities, as opposed to effects or
processes that occur in the natural environment without human influence.
The term is often used in the context of environmental externalities in
the form of chemical or biological waste that are produced as
bi-products of otherwise purposeful human activities.
[5]
According
to terms of the protocol, it enters into force "on the ninetieth
day after the date on which not less than 55 Parties to the Convention,
incorporating parties included in Annex I which accounted in total for
at least 55 per cent of the total carbon dioxide emissions for 1990,
have deposited their instruments of ratification, acceptance, approval
or accession." Of the two conditions, the "55 parties"
clause was reached on May 23, 2002 when
[6] According to the World Bank, the cost of reducing 1 tonne of carbon dioxide in developed nations could be anything between $15 and $100, while it would be around $1 to $4 in developing countries.
[7] A cap-and-trade system is an emission trading system where total emissions are limited or capped. Under Kyoto Protocol emissions from Annex B countries are capped and that excess permits might be traded. It differs from CDM in the sense that the latter allows for more permits to enter the system that is beyond the ‘cap’.
[8] One tonne of carbon dioxide equivalent.
[9] Carbon sequestration is the term describing process that remove carbon dioxide from atmosphere or stops it from entering the atmosphere. Forests eco-system has the potential to capture and retain large volumes of carbon over long periods as trees absorb carbon dioxide.
![]()
Highlights of Current Economic Scene
AGRICULTURE
The
central government has announced Rs 3,750 crore package, including waivers
of Rs 712 crore overdue interest, for the drought-hit Vidarbha region of
- Rescheduling of agricultural credit of Rs 1,296
crore over a period of 3-5 years with a one-year moratorium in the six
drought-affected districts of Amravati, Akola, Washim, Buldhana,
Yavatmal and Wardha,
- Disbursing agricultural credit of Rs 1,275 crore
for the financial year 2006-07 and special teams to be deputed from
National Bank for Agriculture and Rural Development (Nabard) for the
purpose
- Allocation of Rs 2,177 crore under Accelerated
Irrigation Benefit Programme (AIBP) for the completion of major,
medium and minor irrigation projects in the six districts over the
next three years
- Programme worth Rs 180-crore for providing new
cottonseeds to farmers
- A package of Rs 240 crore for water harvesting and
construction of check dams in these districts.
Government
of
The centre has decided to relax phyto-sanitary norms to facilitate wheat import by private players, which would be valid till the end of the current financial year 2006-07. The relaxed norms include higher pesticide tolerance limits for food grain import, in line with internationally accepted CODEX guidelines. The draft has proposed higher tolerance limits for pesticides, including carbaryl, fenitrothion, hydrogen phosphide, inorganic bromide, malathion, phosphamidon and dithiocarbamates.
In view of the shortage of wheat in the central pool, the government has proposed to replace of wheat by issuing 1 million tonnes of coarse grain namely, maize, ragi, bajra and jowar through the public distribution system. It has also considering the proposition to reduce the grain component of the food-for-work programmes, from 5 kg to 3 kg per man-day for the financial 2006-07, while increasing the cash component of the scheme by nearly Rs 614 crore, as an additional budgetary provision.
The centre has extended the ban on more than 10 types of pulses till March 31, 2007, instead of earlier decided date of December 26, 2006. Ban on export of pulses has blocked 200-odd containers loaded with pulses at Kandla and other ports in the Saurashtra Kutch region. As a result the business of at least 10,000 million tonnes of pulses and cereals exported every month from these ports has come to a halt. Exporters, clearing houses, port agents as well as international commodity broking firms, carrying handling agents, and logistics companies have also been adversely affected. The total losses inclusive of transportation charges have been estimated around Rs 4.20 crore. Meanwhile, there are indications of imported pulses arriving in the country from July 2006 itself and would be offloaded at ports in major consumption centres such as Mumbai, Chennai and Kolkata. The imports would be handled by the National Agricultural Cooperative Marketing Federation (Nafed), the Projects and the public sector companies Equipment Corporation (PEC) and MMTC.
In
order to control the rising prices, the central government has imposed a
ban on the export of sugar till March 31, 2007. The ban would not be
applicable to preferential quota sugar exports to the European Union (EU)
and
As per the estimates of Rubber Board, production of rubber in the first quarter of the financial year 2006-07 has increased by 11 per cent to 168,055 tonnes. The rise in domestic prices to more than Rs 100 per kg has encouraged growers to increase their production in the current year. Contrary to this, consumption has risen by just 1.1 per cent at 193,855 tonnes during the same period a year ago. While total rubber exports has moved upwards to 17,767 tonnes registering a robust growth of 1100 per cent, the imports have declined to 14,970 tonnes from 21,551 tonnes recorded during the same period in 2005-06. The total stock has stood at 67,000 tonnes as on June 30, 2006 reporting a decline of 25.6 per cent over the previous year.
State
Bank of
The
State Bank of
As per the long range forecast update of southwest monsoon 2006 released by IMD, the seasonal rainfall for the country as a whole is likely to be 92 per cent of the long period average (LPA) with a model error of + 4 per cent, slightly lower than the earlier forecast of 93 per cent of LPA with the model error of + 5 per cent. Similarly, rainfall for the entire monsoon season 2006 over 4 broad homogeneous regions, namely, northwest, central, southern and northeast, has been pegged at 91 per cent of LPA, 90 per cent of LPA, 97 per cent of LPA and 94 per cent of LPA, respectively with the model error of + 8 per cent each. The second stage forecast of monsoon for July 2006 has projected the rainfall to be 97 per cent of the LPA with a model error of + 9 per cent for the country as a whole.
Industry
Pharmaceuticals
A parliamentary committee has asked the government to bring down the excise duty on all pharmaceutical products from the current 16 per cent to 8 per cent. The move will not only make medicines available at affordable rates to consumers but will also stop the migration of pharma units to states that offer tax exemptions. The committee also suggested inter alia an increase in maximum allowable post manufacturing expense (MAPE) from the current 100 per cent to 150 per cent, complete exemption for cancer and AIDS fighting drugs from any levy (custom or excise), free of cost drugs to be made available to families below poverty line.
Infrastructure
Power
The Central Electricity Regulatory Commission (CERC) has commissioned a regulatory information management study to get reliable baseline data in a comprehensive attempt to check aggregate transmission and commercial (AT&C) losses. The study, to be conducted by KPMG, is to also help states to shift to multi-year tariffs compared to the present system of yearly tariffs.
Over 45 prospective bidders have opted out of the race for the first two of the five proposed ultra mega power projects for which the Government has initiated the bidding process. Of the 74 players that had submitted EoIs (expressions if interest) for two of the 4000 MW-each projects, only 28 players have submitted request for qualification (RFQ) documents or initial bids for the two greenfield projects to come up in Madhya Pradesh and Gujarat. The number could reduce further with developers having raised concerns on whether they would be able to avail themselves of duty sops under the mega power policy since duty concessions under this policy are linked to a condition whereby the state, where the project is to come up, carries out certain reform measures including privatising power distribution in all cities with a population of more than one million within a stipulated deadline, the status of which is still unclear in most states. Also, increased benefits sought by prospective players, such as concessional duty on coal imports as extended to LNG for the revived Dabhol power project, have been mostly refused by the finance ministry. The condition of 12 per cent free power from these projects is an additional issue of contention as is another serious concern regarding the arrangement of fuel. Among the bidders left in the fray for the first two projects are the State-owned NTPC Ltd, Tata Power and Reliance Energy, while AES and China Light and Power are among the foreign players in the race.
Coal
While the coal sector is being opened up to the private sector in a phased manner with allocation of captive mines followed by marketing rights, the coal ministry has initiated plans to position the co-operatives as the third player in the mining sector. The ministry has asked Coal India Ltd (CIL) to prepare a plan to promote formation of cooperatives involving local people in coal bearing areas and engage them in gainful activities by initially entrusting them with transportation and loading jobs. In the second stage, these cooperatives can also be considered for allocation of small and isolated coal blocks.
Aviation
Air
fares in the domestic sector are set to go up 8-15 per cent with all major
airlines planning to increase the fuel surcharge from July 7, 2006 on the
back of a rise in price of aviation turbine fuel (ATF) by less than Rs
1,000 a kilolitre.
Inflation
The annual point-to-point inflation rate based on wholesale price index (WPI) has gone down to 4.84 per cent for the week ended June 24, 2006 from 5.44 per cent during the previous week. This sudden decline in inflation rate is attributed to higher base, which was set last year. The inflation rate was lower at 4.3 per cent in the corresponding week last year.
The WPI in the week under review has increased a tad by 0.1 per cent to 203.6 from 203.4 in the previous week (Base: 1993-94=100). The index of ‘primary articles’ group (weight 22.02 per cent) has risen by 0.2 per cent to 205.7 from the previous week’s level of 205.2, mainly due to a marginal increase in the price index of ‘food articles’ and an increase of 0.9 per cent in the price index of ‘non-food articles’ as compared to the previous week. The index of ‘food articles’ has gone up to 208.8 from 208.7 in the previous week, mainly due to the higher prices of tea, ragi, maize, bajra, moong, gram and eggs. The index of non-food articles has gone up to 183.2 from 181.5 for the previous week, mainly due to the higher prices of logs, timber and sunflower seed. The index of ‘fuel, power, light and lubricants’ group (weight 14.23 per cent) has remained unchanged at its previous weeks’ level of 326.4. The index of ‘manufactured products’ group constituting the maximum of 63.7 per cent of total weight, has risen a tad by 0.1 to 175.5 from the previous weeks’ level of 175.4, mainly due to rise the prices of food products and ‘chemical and chemical products’.
The latest final index of WPI for the week ended April 29, 2006 has been revised upwards; as a result both, the absolute index and the implied inflation rate stood at 199.6 and 3.90 per cent as against their provisional levels of 199 and 3.59 per cent, respectively.
![]()
Banking
In
a bid to regulate the entire payment and settlement system in the country,
including financial transactions of credit card issuers, the government is
planning to accord additional powers to the Reserve Bank of India (RBI) to
regulate and oversee various payment and settlement systems. The finance
ministry has finalised the draft payment and settlement Bill, and will be
introduced in the winter session of Parliament. According to official
sources, the Bill would also enable RBI to regulate entities like the
Clearing Corporation of
With
a view to developing a commercial market for micro finance receivables,
the country's largest private sector bank, ICICI bank has tied up with
Grameen Foundation
Financial Markets
Capital
Markets
Primary Market
The primary market remained subdued with no new issuer tapping the market throughout the week. Meanwhile, Shirdi Industries Limited that tapped the market on June 29 mobilised around Rs 43.55-50.70 crore through its public issue with a price band of Rs 67-78.
Secondary
Market
During
the week, the sustained rise in the international crude oil prices coupled
with the reports related to government’s decision to not to go ahead
with its disinvestments plans in the state run firms and the subsequent
rumours of the resignation of the Prime Minister and Finance Minister in
the wake of halt in the disinvestments plans, which was categorically
denied by the PMO resulted into a highly volatile market. The sensex lost
around 99.72 points or 0.94 per cent to settle at 10509.53 over the week,
while nifty declined by 52.32 points or 1.68 points to close the week at
3075.85. Meanwhile, both BSE Mid-Cap and BSE Small-Cap indices registered
a fall much above than that witnessed by sensex as they closed the week at
4328.05 (1.21 per cent) and 5239.49 (2.19 per cent), respectively.
Interestingly, on July 5, despite the prevailing nervousness in most of
the other Asian markets on account of the missile tests conducted by North
Korea, sensex gained around 257 points over its previous day closing value
to close at 10919.64 as the FIIs has resumed buying after remaining net
sellers for quite some time.
Meanwhile,
over the week the FIIs continued to remain net buyers in the equity market
to the extent of Rs 1140.9 crore with purchases worth Rs 7570 crore and
sales of Rs 6429.2 crore. On the other hands, the mutual funds continued
to remain net sellers in the equity market to the tune of Rs 863.31 crore
with purchases worth Rs 1059.71 crore and sales of Rs 1923.02 crore.
Derivatives
The
total turnover of the NSE’s F & O segment registered a sharp decline
on a weekly basis to Rs 94,727 crore from Rs 152,364 crore in the previous
week, correspondingly the average daily turnover also declined to Rs 18945
crore from Rs 25394 crore. As usual, stock futures continued to dominate
the bulk of the trading at Rs 47073 crore and index options weekly
turnover stood at Rs 36452 crore.
Government
Securities Market
Primary
Market
Under
the regular auction, the RBI mopped up Rs 2000 crore each through 91-day
treasury bill and 364-day treasury bill, respectively and the cut-off
yields for 91-day treasury bill and 364-day treasury bill were 6.3977 per
cent and 7.0513 per cent, respectively. Meanwhile, RBI also announced the
sale (re-issue) of 7.59 per cent 2016 and 7.50 per cent 2034 dated
securities for a notified amount of Rs 5000 crore and Rs 2000 crore
respectively on July 11, 2006.
Secondary
Market
During
the week, the sustained rise in international crude oil prices lead to
increase domestic interest rates worries, thereby firming up the yields on
government securities. Initially, following the RBI governor’s comment
that there is no one-to-one link between global developments and domestic
interest rates, the yields dropped marginally. Further, oil minister’s
denial of concerns of another hike in the domestic fuel prices also
supported the market sentiments. Nonetheless, apprehension ahead of the
fresh auction of scheduled dated government securities kept the market
bearish and even the announcement of a cut in the gilt auction size to Rs
7,000 crore from Rs the scheduled Rs 10,000 crore failed to boost the
market sentiments. The yield on 7.59 per cent 2016 paper closed higher at
8.21 per cent as compared to 8.14 per cent in the previous week.
Meanwhile, the government borrowings are estimated to face a slight
slippage on account of the failure of disinvestments efforts for the
current fiscal. On the other hand, increased government spending resulted
into an increase in the available liquidity in the market as the call
rates traded around the reverse repo rate throughout the week to close
flat at 5.75-5.85 per cent. The daily average outstanding amounts in the
LAF (reverse repo) operations conducted during the week stood at Rs 56908
crore as compared to Rs 41686 crore in the previous week.
Bond Market
The
corporate bond yields witnessed mixed trend during the week as in the
initial part of the week the prospects of a reduction in the fresh gilt
issue resulted into a decline of the yields; but the growing expectations
of an interest rate hike in the upcoming monetary policy review later in
the month on account of the sustained rise in the global oil prices capped
the market sentiments. The yields of the short-term eased by 2-5 basis
points while those at the medium and long term ended flat. The triple-A
rated benchmark yields eased to 8.53 per cent from 8.55 per cent in the
previous week.
Foreign
Exchange Market
During
the week, the rupee has depreciated against dollar by around 14 basis
points to Rs 46.12 per dollar on July 7,2006 from Rs 45.98 on July 3,
2006. Heavy oil related dollar demands by corporate following the
sustained rise in international crude oil prices coupled with the overall
nervousness in the international market on account of the missile test
conducted by
Commodities
Futures Derivatives
The
potato futures trading, launched on July 7,on NCDEX, has registered a
turnover of Rs 9.46 crore. August delivery contract witnessed maximum
trading value at Rs 7.35 crore amidst 671 contracts for 12720 metric tonne
The
LC Gupta committee has drafted suggestions on preparation of byelaws
regarding options trading in commodities and the final report is likely to
be submitted by early August.
Meanwhile,
NCDEX has postponed the launch of onions contracts till further notice
following the directives given to them by FMC.
MCX
has, on July 6, imposed a special margin of 4 per cent and an additional
margin of 5 per cent on open positions in mentha oil contracts as a risk
management measure, thus the total margin applicable on mentha oil futures
will be 27 per cent. The special margin of 4 per cent will be levied on
all open positions (short as well as long) in mentha oil contracts of
members. ![]()
Rating Actions .
ICRA has retained ‘A1+’ rating for the commercial paper /short-term debt programme of CMC Limited (CMC) for an enhanced amount of Rs. 500 million (from Rs. 300 million earlier). The reaffirmation of the rating takes into account CMC’s established position in the maintenance and systems integration segments of the domestic IT services industry, strong vertical industry skills and a long track record of implementing key projects for the Government, public sector undertakings (PSU’s) and private enterprises.
ICRA has put ‘A1+’ rating assigned to the Rs. 300 million commercial paper programme of Liberty Shoes Limited ( LSL) on rating watch with developing implications, because of disruption of production activities at its Libertypuram plant following a labour unrest.
ICRA has assigned an ‘LAA’ rating to the Rs. 1500 million non convertible debenture programme of Cholamandalam DBS Finance Ltd. (CDFL). The outstanding medium term non convertible debentures of CDFL and fixed deposits have been reaffirmed at ‘MAA+’.
The ratings factor in CDFL’s increased focus in the commercial vehicle (CV) markets, its good asset quality in this segment, moderate leverage and capitalisation on account of recent equity infusions, its financial flexibility on account of a diversified funding and its experienced and competent management.
ICRA has assigned an ‘A1+’ rating to the Rs 20 billion (enhanced from Rs 10 billion) certificate of deposit programme of State Bank of Mysore (SBM). The assigned rating takes into account SBM’s strong presence in the corporate assets, its growing retail asset portfolio, improving asset quality and comfortable liquidity.
CRISIL has reaffirmed the ‘AAA (SO)/Stable’ to Rs 2.5 billion non convertible bonds of National Textile Corporation Limited (NTCL), the reaffirmation takes into account unconditional and irrevocable guarantee provided by government of India.
Corporate Sector
Bajaj Auto has registered an increase of 33 per cent at 1.88 lakh units in June 2006. In the motorcycle segment, the company has reported 40 per cent growth during the month under review with total volume of 1.84 lakh units as against 1.31 lakh units in June 2005. The company has reported 116 per cent jump in exports of two- and three-wheelers with volumes at 34,369 units in June 2006, as against 15,946 in June 2005. In the first quarter of 2006 Bajaj Auto’s overall two-wheeler sales has gone up by 28 per cent to 5.79 lakh units, while exports surged by 95 per cent to 98,263 units.
TVS Motor has reported a 17 per cent rise in total two-wheeler sales in June 2006 at 1.27 lakh units, compared with 1.08 lakh units a year ago. The motorcycle sales in June 2006 have stood at 74,683 units, up 24 per cent from 60,170 units sold in June 2005. The company’s exports have augmented by 36 per cent at 10,220 units over a year ago.
Associated Cement Companies (ACC) has registered a rise of 4 per cent in cement sales at 15.41 lakh tonne in June 2006 as against 14.73 lakh tonne sold a year ago. During the first six months of 2006 (January-June), total sales of the company has stood at 96.54 lakh tonne, a 7.1 per cent higher than 90.16 lakh tonne over the corresponding period previous year.
Larsen and Toubro (L&T) has secured four major orders worth Rs 329 crore from the Indian Oil Corporation and Bongaigaon Refinery and Petrochemicals for their ongoing expansion projects. The orders would be executed by L&T’s heavy engineering division.
Bharat
Heavy Electricals Limited (BHEL) has received two contracts worth Rs 842
crore for setting up two thermal power projects in Rajasthan. The
contracts have been placed by Rajasthan Vidyut Utpadan Limited for setting
up a 250-mega watt (MW) unit at Suratgarh thermal power station and 195 MW
unit at
Godrej Consumer Products Limited has entered into an agreement to acquire the South African hair colour business of the UK based Rapidol as well as its subsidiary Rapidol International for an undisclosed amount.
Two and three-wheeler major, Bajaj Auto, has bought an additional 1.42 per cent shares in ICICI Bank for Rs 633 crore, raising its share holding to 4.13 per cent.
Labour
The ambitious ‘National Rural Employment Guarantee Scheme’ (NREGS), which has proposed to provide at least 100 days of guaranteed employment a year to every household in rural areas, launched by the government this year, does not seem to progress as per expectations. Till date, given that 2.90 crore people have applied for jobs, only 1.91 crore job cards have been issued and only 56.40 lakh people have been actually given employment. Moreover, according to the findings of ‘Participatory Research Initiative Asia’, an advocacy group, which conducted a field survey in 11 states, it has been noticed that there are cases of discrimination based on caste and community, delay in issuing job cards and making payments, low public awareness and untrained government officials. Therefore, in order to strengthen the monitoring of the scheme, the Ministry of Rural Development has sought the services of IIM-B and four other reputed institution.
Information Technology
The country's largest software exporter, Tata Consultancy Services (TCS), and the country's largest commercial bank, State Bank of India (SBI), has announced a joint venture in the technology space for the banking domain. TCS and SBI will have a 51 per cent and 49 per cent stake holding respectively in the new venture to be called C-Edge Technologies Ltd (CETL). Initially CETL will have an authorised capital of Rs 40 crore and will also provide high-end domain consulting and will create knowledge both in the IT and BPO space.
![]()
|
Macroeconomic Indicators |
|
Table
1 : Index Numbers of Industrial Production (1993-94 =100) |
|
Table
2 : Production in Infrastructure Industries (Physical Output Series) |
| Table 3: Procurment, Offtake and Stock of foodgrains |
|
Table
4: Index Numbers of Wholesale Prices (1993-94 = 100) |
|
Table
5 : Cost of Living Indices |
|
Table
6 : Budgetary Position of Government of India |
|
Table
7 : Government Borrowing Programmes and Performance |
|
Table
8 : Scheduled Commercial Banks -
Business |
|
Table
9 : Money Stock : components and Sources |
|
Table 10 : Reserve Money : Components and Sources |
|
Table
11 : Average Daily Turnover in Call Money Market |
|
Table
12 : Assistance Sanctioned and Disbursed by All-India Financial
Institutions |
|
Table
13 : Capital Market |
|
Table
14 : Foreign Trade |
|
Table 15 : India's Overall Balance of Payments |
|
Table
16 : Foreign Investment Inflows |
| Table 17 : Foreign Collaboration Approvals (Route-Wise) |
| Table 18 : Year-Wise (Route-Wise) Actual Inflows of Foreign Direct Investment (FDI/NRI) |
|
Table
19 : NRI Deposits - Outstandings |
|
Table
20 : Foreign Exchange Reserves |
|
Table 21 : Indices REER and NEER of the Indian Rupee |
|
Table
22 : Turnover in Foreign Exchange Market |
| Table 23 : India's Template on International Reserves and Foreign Currency Liquidity [As reported under the IMFs special data dissemination standards (SDDS) |
| Table 24 : Settlement Volume and Netting Factor for Government Securities Transactions Settled at CCIL - Monthly, Quarterly and Annual Basis. |
| Table 25 : Inter-Catasegory Distribution of All Types of Trade in Government Securities Settled at CCIL (With Market Share in Respective Trade Types) |
| Table 26 : Category-wise Market Share in Settlement Volume of Government Securities Transactions (in Per Cent) |
| Table 27 : Settlement Volume and Netting Factor for Total Forex Transactions Settled at CCIL - Monthly, Quarterly and Annual Basis. |
| Table 28 : Inter-Category Distribution of Total Foreign Exchange Transactions Settled at CCIL (With Market Share in Respective Trade Types) |
![]()
|
Memorandum Items |
*These statistics and the accompanying review are a product arising from the work undertaken under the joint ICICI research centre.org-EPWRF Data Base Project.
We will be grateful if you could kindly send us your feed back at epwrf@vsnl.com